
Analysis:
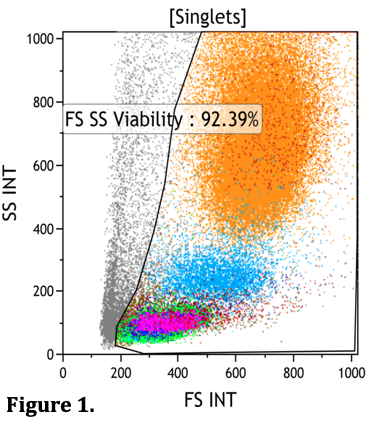
Figure 1 shows a typical forward scatter (x-axis, FS) versus side scatter (y-axis, SS) plot for a bone marrow specimen. This plot allows you to see the populations present within the sample. The FS allows assessment of cells by size, while the SS allows cell assessment of the granularity of the cells. Dead cells and/or debris are gated out by excluding low FS and high SS events (gray population).
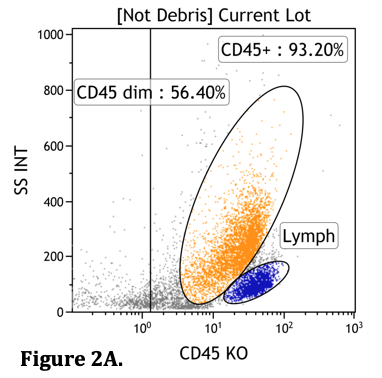
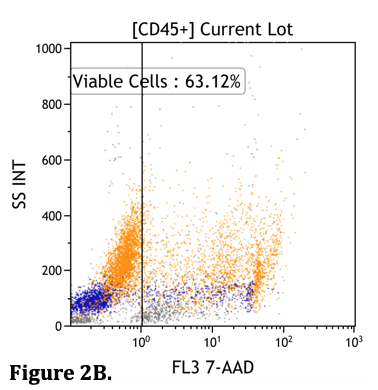
Figure 2A and 2B show another way to gate out dead cells. A viability dye (7-AAD, x-axis) is used which is able to penetrate cells that are dead or dying due to poor membrane integrity. In this case 2A shows two populations, a dimCD45+ population (yellow) and lymphocytes (blue). Figure 2B shows the addition of the viability dye, 63% of the cells do NOT take up the dye and are therefore viable.
Next page: Analysis of CD45 versus SS plot of a Bone Marrow Specimen
Previous page: Processing, Staining, Acquisition