
Analysis of CD45 versus SS plot of a Bone Marrow Specimen:
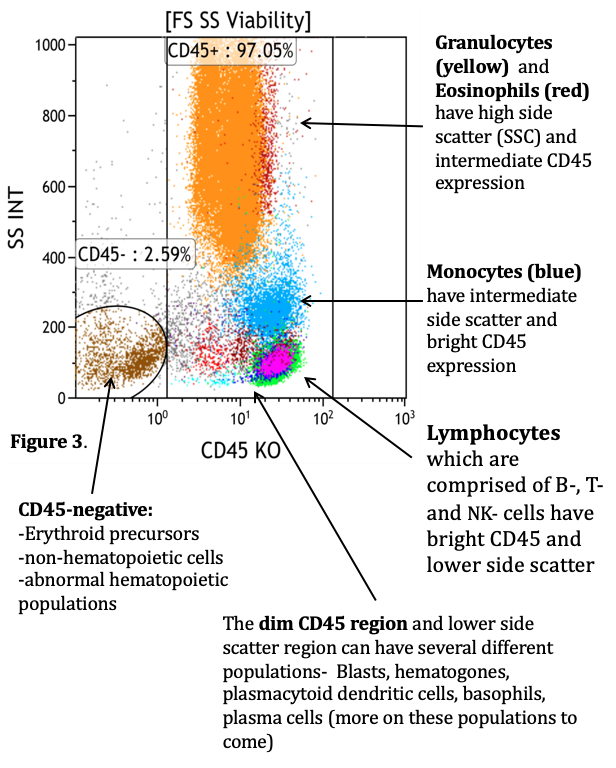
[CD45+] tells you the plot is limited to CD45+ events only.
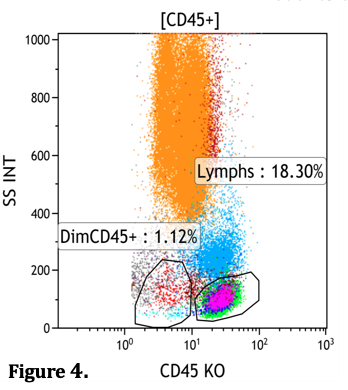
To determine the proportion of each type of cell present you can gate the populations. In this example (Figure 4) a gate is drawn around the dim CD45 region which shows 1.12% of CD45+ events. Lymphocytes which appear as a cluster with brighter CD45 expression are 18.3% of all CD45+ events.
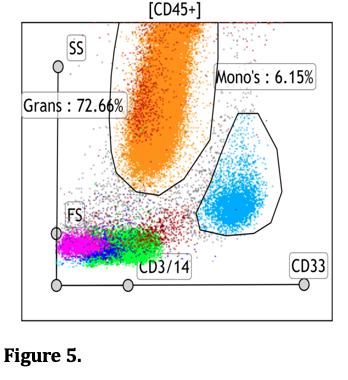
This plot (Figure 5) is called a Radar plot, it allows you to put more than 2 parameters on a single dot plot. In this example we are looking at SS (side scatter), FS (forward scatter) on the y-axis and CD3/14 and CD33 expression on the x-axis.
*Note that in this example CD3 and CD14 are on the same fluorochrome because they are usually mutually exclusive antigens. CD3 to identify T-cells and CD14 to identify monocytes.
Next page: Step 1: B-cell interrogation