
Step 1: B-cell interrogation:
It doesn’t matter which population you interrogate first, however, it is good to have systematic approach. In this example, we will start with B-cells, followed by T-cells, followed by monocytes and immature cells.
Step 1: B-cell interrogation:
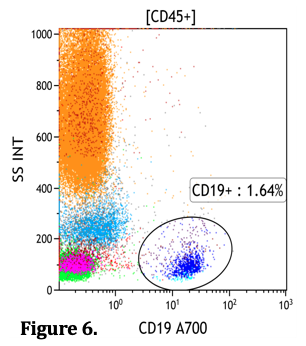
Figure 6: Looking at the CD45+ subset, we can see what % of CD19+ cells are present
CD19+ cells include hematogones, mature B-cells and plasma cells.
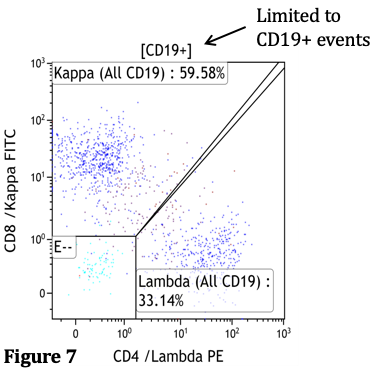
Figure 7: Next we restrict our analysis to CD19+ cells and look at the Kappa (y-axis) to Lambda (x-axis) ratio. You will see some cells negative for kappa and lambda (E--, turquoise), these are immature B-cells or hematogones. The ratio in this example is 59.58/33.14 which is 1.80.
*Note: In these screening tubes we sometimes have two antibodies linked to same fluorochrome. In this case CD8 and Kappa are linked to FITC and CD4 and lambda are linked to PE. The antibodies must be mutually exclusive (ie. not present on the same cells) for this strategy to work.
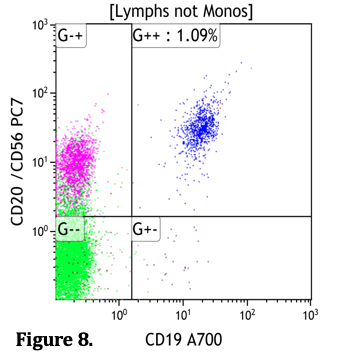
Figure 8: In this plot we are looking at CD20 (y-axis) vs. CD19 (x-axis) to determine the number of mature B-cells present (blue). In this example we have CD20 and CD56 on the same fluorochrome, the population that is CD19-negative and CD56-positive are NK cells (pink). The population in green is negative for CD20, CD56 and CD19, these are presumably T-cells, however we can check that in a subsequent plot with antibodies against CD3 or CD5 which are T-cell markers.
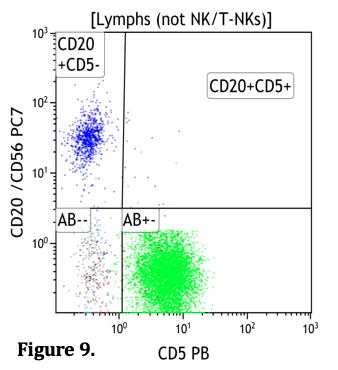
Figure 9: Limited to Lymphocytes (excluding CD56+ lymphocytes, ie. NK or T-NK cells).
When looking for lymphoproliferative neoplasms two important markers are CD5 and CD10.
In this plot we are looking at CD20 (y-axis) vs. CD5. There is no significant population of CD20+/CD5+ B-cells present. The population in green CD20-/CD5+ are T-cells.
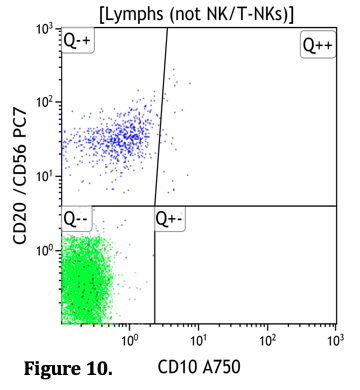
Figure 10: CD20 is on the y-axis and CD10 is on the x-axis.
There is no significant population of CD20+/CD10+ B-cells present.
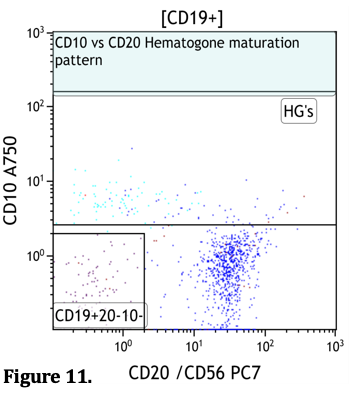
Figure 11: In this plot we have changed our gating strategy to look again at all CD19 positive cells. CD20/CD56 is on the x-axis and CD10 is on the y-axis.
Hematogones (“HGs” Turquoise) show variable expression of CD20 and are positive for CD10. When they mature they lose expression of CD10.
The cells that are CD19+, CD20- and CD10- are presumably plasma cells. If the proportion of these cells are increased, you will follow up with further testing.
Next page: Step 2: T-cell interrogation
Previous page: Analysis of CD45 versus SS plot of a Bone Marrow Specimen