
Step 2: T-cell interrogation:
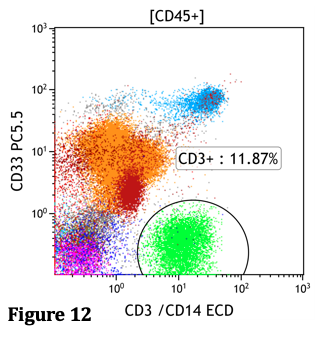
Figure 12: This plot shows CD33 (y-axis) and CD3/CD14 (x-axis). Cells that are positive for CD33 and CD14 are monocytes (blue population). T-cells which are CD3 positive and negative for CD33 are seen in green. In this example, T-cells are 11.87% of all CD45+ cells (gate at the top of the plot).
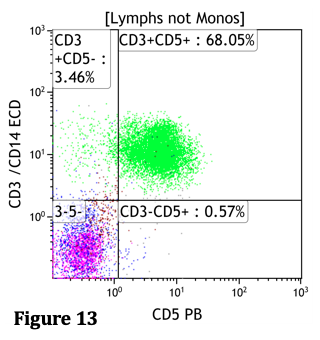
Figure 13: To further analyze the T-cells (Green), we can look at CD5, CD3+CD5+ T-cells are 68% of Lymphocytes (gating at the top is limited to Lymphs). The CD3-/CD5- populations at the bottom left are comprised of B-cells and NK cells.
Note: some abnormal T-cell populations may be negative for surface CD3. In that case you may have to do cytoplasmic CD3 staining for confirmation. Likewise, some abnormal T-cell populations are negative for CD5.
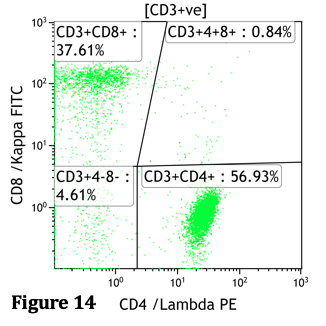
Figure 14: To determine the CD4 to CD8 ratio of T-cells, the gate is limited to CD3+ cells. CD8 is shown on the y-axis and CD4 is on the x-axis. Notice that in this example, the CD8 and Kappa are on the same fluorochrome (FITC) and CD4 and Lambda are on the same fluorochrome (PE). Using this plot you can also see whether any double positive (CD4+/CD8+) or double negative (CD4-/CD8-) T-cell populations are present.

Figure 15: The gate at the top is limited to T-cells and NK-cells (to avoid having B-cells in this plot). CD56 on the y-axis shows a population consistent with NK cells (CD3-, CD56+). CD3 expression is on the x-axis and a small population is identified which is CD3+CD56+, these cells are called T-NK cells.
Next page: Step 3: Myeloid populations
Previous page: Step 1: B-cell interrogation